Monthly breakdown
When values stored in a calculation are for a specific period of time, it can be helpful to see the calculation's values spread over that period of time in a monthly breakdown. If your plan includes periodic breakdowns, you can use this functionality.
Prerequisites
To include a monthly breakdown, there are two prerequisites:
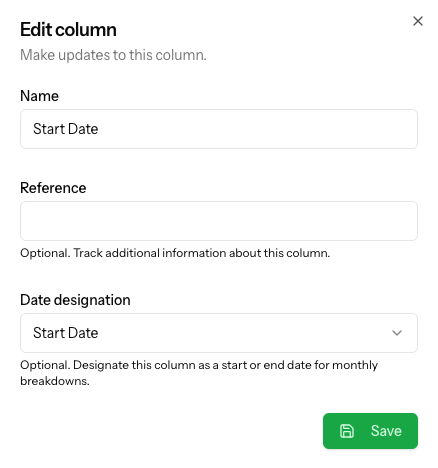
- A date column that is designated as the Start Date
- A date column that is designated as the End Date
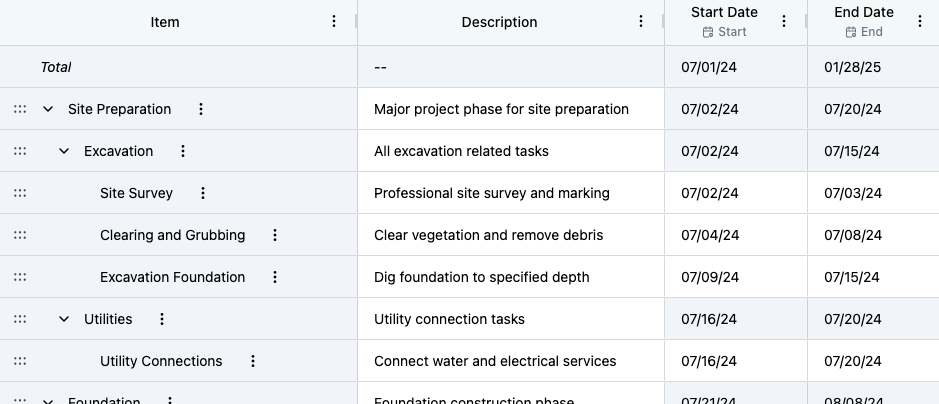
The start and end date will represent the time frame for each row of data. The start and end date can differ for each row of data - it is not required to have the same date for the row. As described in the Column section, if the calculation includes nested rows, the lowest level rows will be editable while the parent rows (rollup rows) will summarize the time frame of the parent's child rows.
Understanding the monthly breakdown options
Monthly breakdowns includes two options: Consider days and Spread evenly. Following are explanations of each.
Consider days
When viewing the monthly breakdown using the "Consider days" option, the quantity and amount values will be distributed over the time period considering the exactly number of days within the months involved. Using this option, for example, a row that has a started date of February 1, an end date of March 31, and an amount column with 100, the monthly breakdown would show 47.46 for February (28 days) and 52.54 for March (31 days) - because March has more days, the March monthly breakdown will account for more of the total.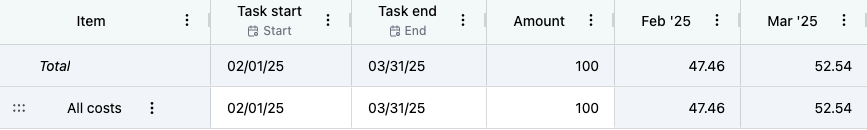
Spread evenly
In some instances, especially when planning at a higher level, the user may simply want to see the amounts distributed evenly among the affected months. In those instances, use the Spread evenly option which will not consider the days in the month nor where the start and end dates fall within the month - the values will simply be spread evenly across the affected months. Using the same example, the 100 will be spread evenly across the affected months with February 2025 = 50 and March 2025 = 50.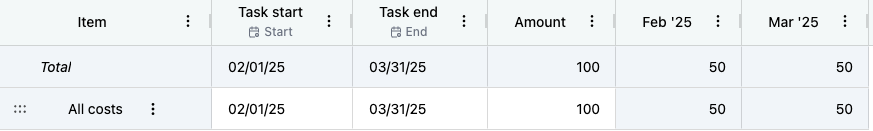
Using a running sum with monthly breakdown
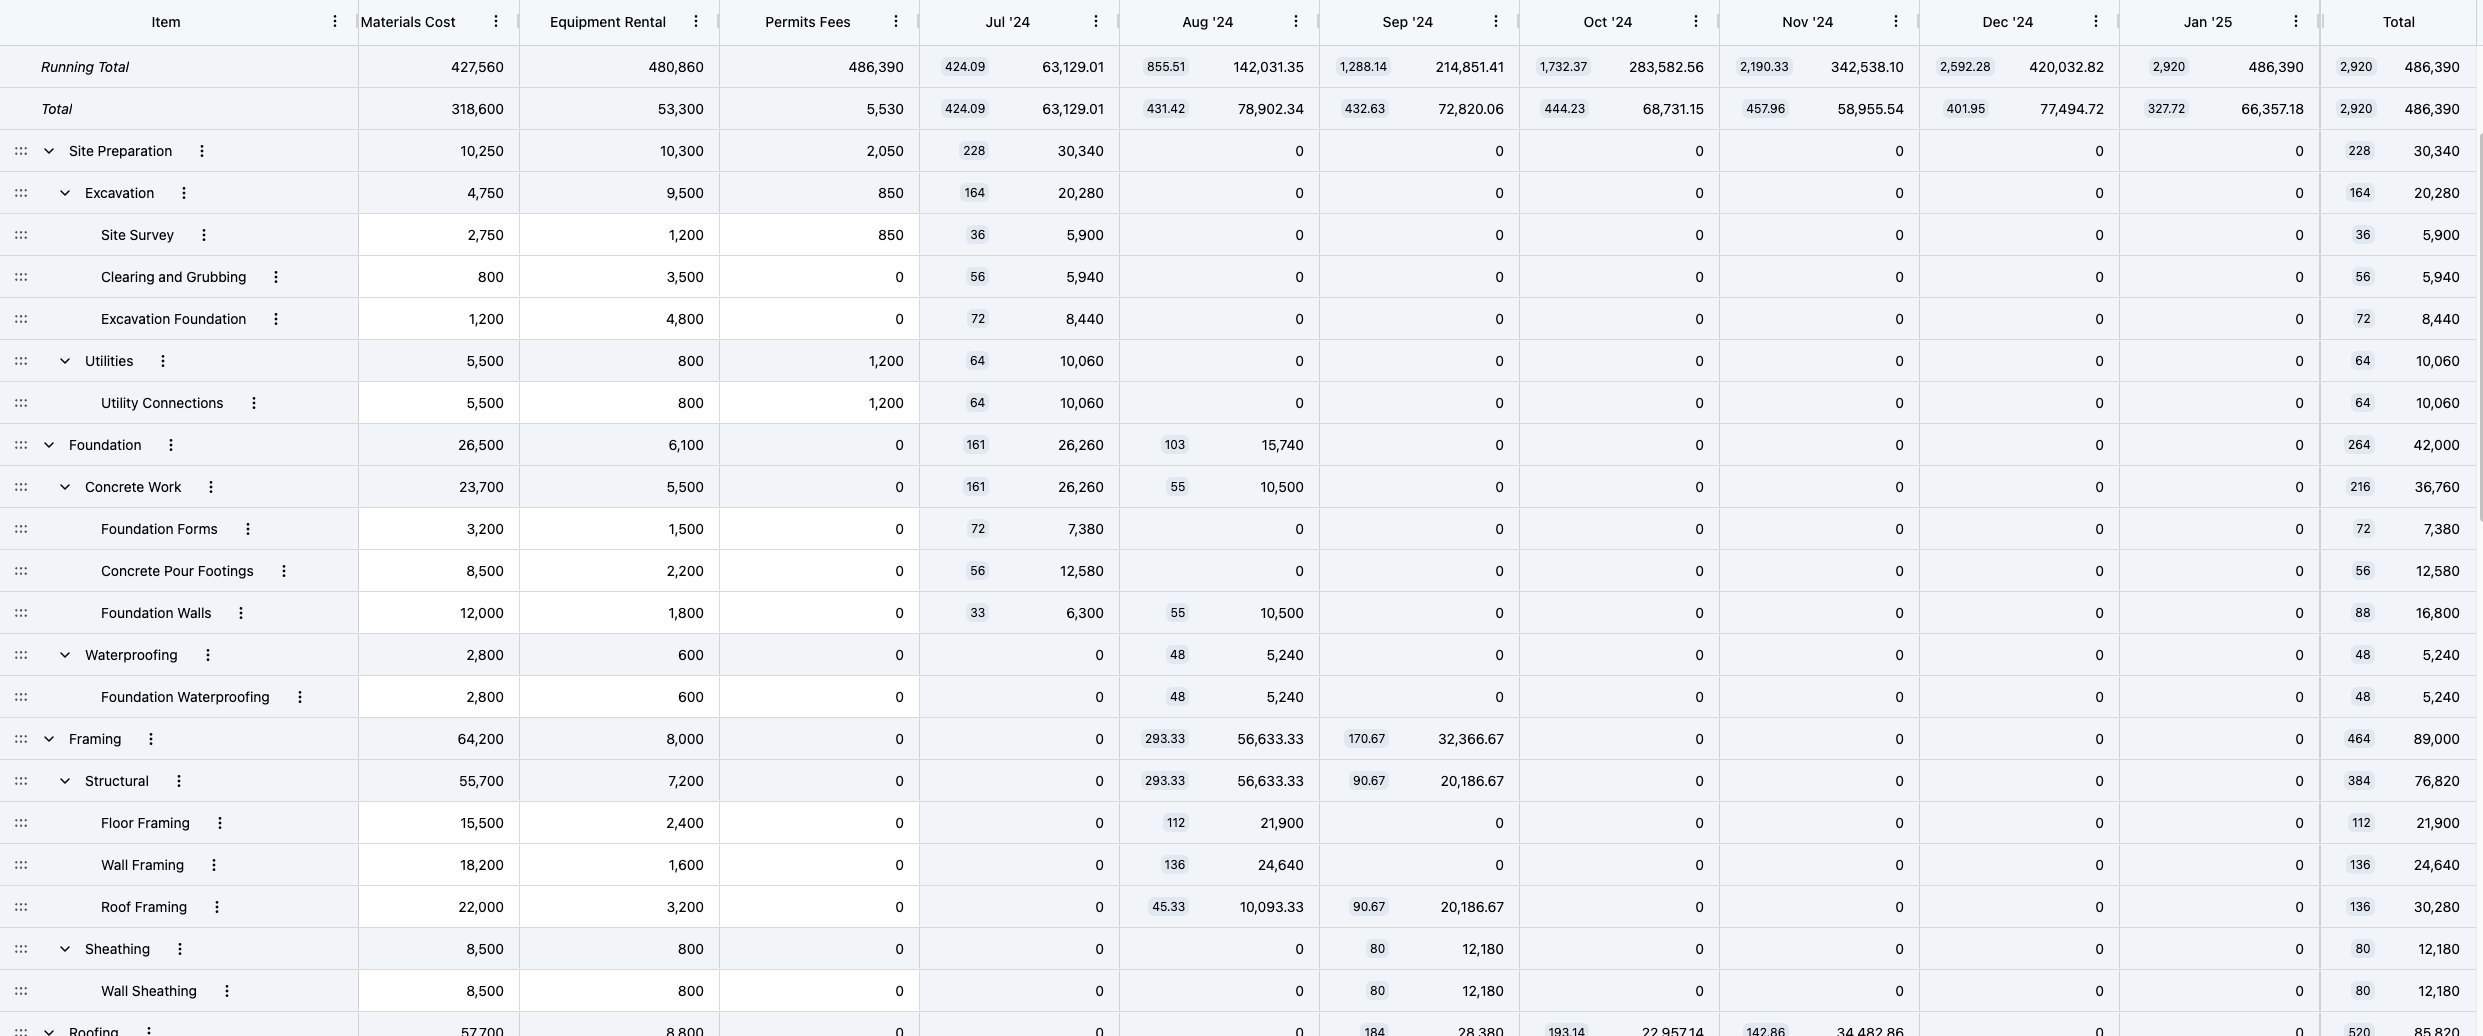
Once the correct monthly breakdown option is applied, the running sum functionality can be added to further enhance the calculation. Viewing the running sum with the monthly breakdown, the user can view the values as the calculation progresses over time.
One example of using running sum with monthly breakdown is seeing a project's costs accumulate over time - this is often referred to as the project cost burn curve. The burn curve shows the capital requirements over time to better understand cash flow requirements.